Base Card Value: Gaussian vs Poisson
/All of these mathematical endeavours begin with the presumption that Blizzard has a secret formula it uses to compute the amount of mana a card ought to cost. The value on the card will be different on the card for one of three reasons - the influence of mechanics, the effects of rounding (because a card costs 1 or 2 mana, not 1.5), and tweaking based on how it plays (variance introduced through human evaluation).
What we're ultimatley trying to build (for the base card value) is a model of the basic relationships between the values on the card (Attack, Health, and Mana), and these other effects, to 'reverse-engineer' the basic formula.
A standard lm model uses a family of functions for analyzing the variance of a dataset based on the assumption that there's a gaussian distribution in your data, and is primarily concerned with producing a binary predictor for those values.
As always, model fitting is part art, part science, and part throwing shit at the wall to see what works. Or, it is when I do it, at any rate.
So.
Given our belief that there's a direct, additive relationship between the base card value and the attack/defense values on the card, in theory, a glm on a poisson family should get you a better fit than the gaussian; it better represents the expected behaviour of a count variable. But is it true?
First, the original, gaussian LM fit from last time.
  Call: lm(formula = Mana ~ Attack + Health, data = dataset, subset = CardType == 1 & CardText == "" & Mana > 0)

  Residuals: Min 1Q Median 3Q Max -1.9940 -0.2844 0.1968 0.2218 0.7611

  Coefficients: Estimate Std. Error t value Pr(>|t|)
  (Intercept) -0.16376 0.14999 -1.092 0.283
  Attack 0.50626 0.06172 8.202 2.28e-09 _*_

  ## Health 0.43566 0.06107 7.134 4.27e-08 _*_

  Signif. codes: 0 ‘**_’ 0.001 ‘_**_’ 0.01 ‘_’ 0.05 ‘.’ 0.1 ‘ ’ 1

  Residual standard error: 0.4999 on 32 degrees of freedom Multiple R-squared: 0.9359, Adjusted R-squared: 0.9319 F-statistic: 233.6 on 2 and 32 DF, p-value: < 2.2e-16
The autoplot for lm(formula = Mana ~ Attack + Health), showing a fit using the gaussian family.
Now let's change tack.
If we presume that our outcome value is "count"-like - additive in nature from the base values on the card - we can switch to the generalized linear model, and switch to a poisson distribution - with intriguing results.
glm(formula = Mana ~ Attack + Health, family = family, data = dataset, subset = CardType == 1 & CardText == "" & Mana > 0)

Deviance Residuals:
    Min       1Q   Median       3Q      Max
-1.0093  -0.2435  -0.1382   0.2194   0.9077

Coefficients:
            Estimate Std. Error z value Pr(>|z|)
(Intercept) -0.17849    0.23141  -0.771   0.4405
Attack       0.14891    0.06234   2.389   0.0169 *
Health       0.16466    0.06622   2.487   0.0129 *
---
Signif. codes:  0 ‘***’ 0.001 ‘**’ 0.01 ‘*’ 0.05 ‘.’ 0.1 ‘ ’ 1

(Dispersion parameter for poisson family taken to be 1)

    Null deviance: 44.9140  on 34  degrees of freedom
Residual deviance:  4.4248  on 32  degrees of freedom
AIC: 101.1

Number of Fisher Scoring iterations: 4
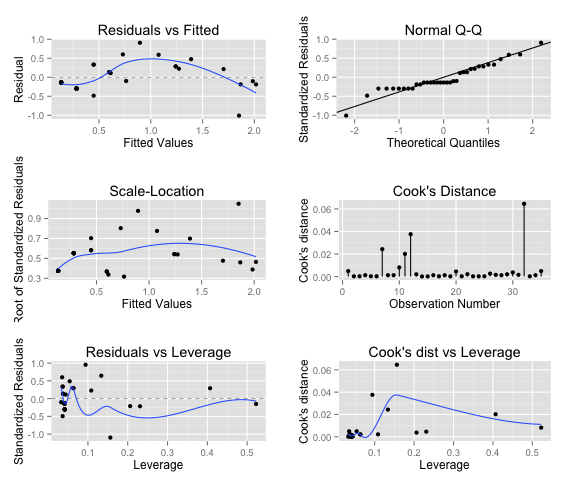
The autoplot for lm(formula = Mana ~ Attack + Health, family=poisson), showing a fit using the poisson family.
Note the differences in the two sets of graphs:
Residuals are healthier. The residuals on the poisson distribution have better deviations; LM range was -1.9940 to 0.7611 (~2.75); our Poisson GLM is -1.0093 to 0.9077 (~1.9).
Residual QQ is better. The two graphs are day and night; you now see a nice, clean, quantized Q-Q for the residuals, showing the stair-stepping you'd expect to see when you know that whatever magic formula exists has the effects of rounding (because mana is an integer) applied.
Cook's Distance improved. We go from having some pretty strange outliers to being within 0.06 on all modelled values.
Scale-Location and Residuals Vs Leverage also see huge improvements over their normal counterpart.
In short, the poisson family appears to do a much better job of estimating the base value of the card than the normal family.